
Trading strategies
Explore practical techniques to help you plan, analyse and improve your trades.
Our library of trading strategy articles is designed to help you strengthen your market approach. Discover how different strategies can be applied across asset classes, and how to adapt to changing market conditions.


From tech disruptors to defence contractors, some of the market's most talked-about companies start their public journey through an initial public offering (IPO). For traders, these initial public listings can represent a unique trading environment, but also a period of heightened uncertainty.
Quick facts
- An IPO is when a private company lists its shares on a public stock exchange for the first time.
- IPOs can offer traders early access to high-growth companies, but come with elevated volatility and limited price history.
- Once listed, traders can gain exposure to IPO stocks through direct share purchases or derivatives such as contracts for difference (CFDs).
What is an initial public offering (IPO)?
An IPO is when a company offers its shares to the public for the first time.
Before performing an IPO, shares in the company are typically only held by founders, early employees, and private investors. Going public makes the shares available to be purchased by anyone.
Depending on the size of the company, it will usually list its public shares on the local stock exchange (for example, the ASX in Australia). However, some large-valuation companies choose to only list on a global stock exchange, like the Nasdaq, no matter where their main headquarters is located.
For traders, IPOs are generally the first opportunity to gain exposure to a company’s stock. They can create a unique environment with increased volatility and liquidity, but also carry heightened risk, given the limited price history and sensitivity to sentiment swings.
Why do companies go public?
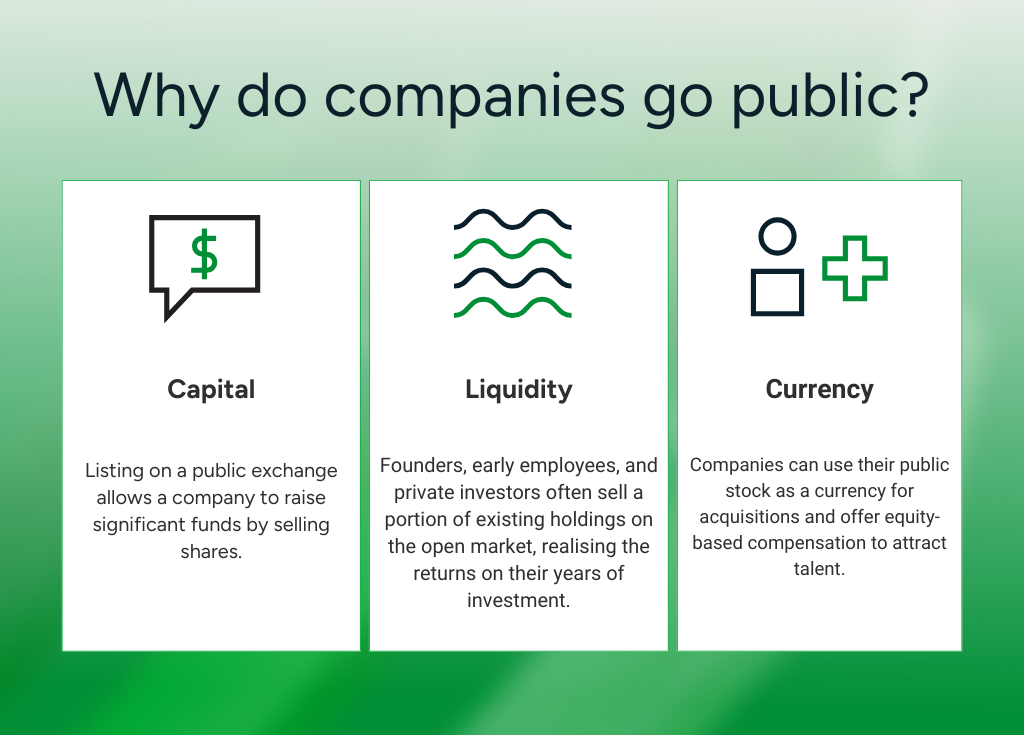
The biggest driver to perform an IPO is to access more capital. Listing on a public exchange means the company can raise significant funds by selling shares.
It also provides liquidity for existing shareholders. Founders, early employees, and private investors often sell a portion of their existing holdings on the open market, realising the returns on their years of support.
Beyond the monetary benefits, going public means companies can use their stock as currency for acquisitions and offer equity-based compensation to attract talent. And a public valuation provides a transparent benchmark, which is useful for strategic positioning and future fundraising.
However, it does come with trade-offs. Public companies must comply with ongoing disclosure and reporting obligations, and pressure from public shareholders can become a barrier to long-term progress if many are focused on short-term performance.
How does the IPO process work?
While the specifics vary by jurisdiction, going from a private company to a public listing generally involves the following stages:
1. Preparation
The company first selects the underwriter (typically an investment bank) to manage the offering. Together, they assess the company's financials, corporate structure, and market positioning to determine the best approach for going public. It is the heavy planning stage to make sure the company is actually ready to go public.
2. Registration
Once everything is prepared, the underwriters conduct a thorough due diligence check and then lodge the required disclosure documents with the relevant regulator. These documents give a detailed disclosure to the regulator about the company, its management, and its proposed offering. In Australia, this is typically a prospectus lodged with ASIC; in the US, a registration statement filed with the SEC.
3. Roadshow
Executives at the company and underwriters will then present the investment case to institutional investors and market analysts in a “roadshow”. This showcase is designed to gauge demand for the stock and help generate interest. Institutional investors can register their interest and valuation of the IPO, which helps inform the initial pricing.
4. Pricing
Based on feedback from the roadshow and current market conditions, the underwriters set the final share price and determine the number of shares to be issued. Shares are allocated on the ‘primary market’ to investors participating in the offer (before the stock is listed publicly on the secondary market). This process sets the pre-market price, which effectively determines the company’s initial public valuation.
5. Listing
On listing day, the company’s shares begin trading on the chosen stock exchange, officially opening the secondary market. For most traders, this is the first point at which they can trade the stock, either directly or through derivatives such as Share CFDs.
6. Post-IPO
Once listed, the company becomes subject to strict reporting and disclosure requirements. It must communicate regularly with shareholders, publish its financial results, and comply with the governance standards of the exchange on which it is listed.
IPO risks and benefits for traders

How do traders participate in IPOs?
For most traders, participating in an IPO comes once shares have listed and begun trading on the secondary market.
Once shares are live on the exchange, investors can buy the physical shares directly through a broker or online exchange, or they can use derivatives such as Share CFDs to take a position on the price without owning the underlying asset.
The first few days of IPO trading tend to be highly volatile. Traders should ensure they have taken appropriate risk management measures to help safeguard against potential sharp price swings.
The bottom line
IPOs mark when a company becomes investable to the public. They can offer early access to high-growth companies and create a unique trading environment driven by elevated volatility and market interest.
For traders, understanding how the process works, what drives pricing and post-IPO performance, and how to weigh potential rewards against the risks of trading newly listed shares is essential before taking a position.


2026 is not giving investors much breathing room. It seems markets may have largely moved past the idea that rate cuts are just around the corner and into a year where inflation may prove harder to control than many expected.
Goods inflation has picked up, while services inflation remains relatively sticky due to ongoing labour cost pressures. Housing costs, particularly rents, also remain a key source of inflation pressure.
The RBA is trying to stay credible on inflation without pushing the economy too far the other way.
Key data
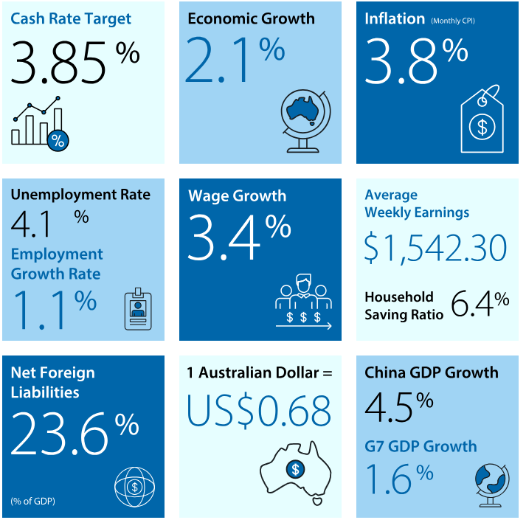
CPI is still around 3.8 per cent (above target), wages are still rising at about 0.8 per cent over the quarter, and unemployment is around 4.1 per cent.
Based on market-implied pricing, rate hikes are not expected soon, so the way the RBA explains its decision can matter almost as much as the decision itself. If the tone shifts expectations, those expectations can move markets.
What this playbook covers
This is a playbook for RBA-heavy weeks in 2026. It covers what to watch across sectors, lists the key triggers, and explains which indicators may shift sentiment.
1. Banks and financials: how RBA decisions flow through to lending and borrowers
Banks are where the RBA shows up fastest in the Australian economy. Rates can hit borrowers quickly and feed into funding costs and sentiment.
In tighter phases, margins can improve at first, but that can flip if funding costs rise faster, or if credit quality starts to weaken. The balance between those forces is what matters most.
If banks rally into an RBA decision week, it may mean the market thinks higher for longer supports earnings. If they sell off, it may mean the market thinks higher for longer hurts borrowers. You can get two different readings from the same headline.
What to watch
- The yield curve shape: A steeper curve can help margins, while an inverted curve can signal growth stress.
- Deposit competition: It can quietly squeeze margins even when headline rates look supportive.
- RBA wording on financial stability, household buffers, and resilience. Small phrases can shift the risk story.
Potential trigger
If the RBA sounds more hawkish than expected, banks may react early as markets reassess growth and credit risk expectations. The first move can sometimes set the tone for the session.
Key risks
- Funding costs rising faster than loan yields: May point to margin pressure.
- Clear tightening in credit conditions: Rising arrears or refinancing stress can change the narrative quickly.
2. Consumer discretionary and retail: where higher rates hit household spending
When policy is tight, consumer discretionary becomes a live test of household resilience. This is where higher everyday costs often show up fastest.
Big calls about the consumer can look obvious until the data stops backing them up. When that happens, the narrative can shift quickly.
What to watch
- Wages versus inflation: The real income push or drag.
- Early labour signals: Hours worked can soften before unemployment rises.
- Reporting season clues: Discounting, cost pass-through, and margin pressure can indicate how stretched demand really is.
Potential trigger
If the tone from the RBA is more hawkish than expected, the sector may be sensitive to rate expectations. Any initial move may not persist, and subsequent price action can depend on incoming data and positioning
Key risks
- A fast turn in the labour market.
- New cost-of-living shocks, especially energy or housing, that hit spending quickly.
3. Resources: what to watch when tariffs, geopolitics, and policy shift
Resources can act as a read on global growth, but currency moves and central bank tone can change how that story lands in Australia.
In 2026, tariffs and geopolitics could also create sharper headline moves than usual, so gap risk can sit on top of the normal cycle.
The RBA still matters through two channels: the Australian dollar and overall risk appetite. Both can reprice the sector quickly, even when commodity prices have not moved much.
What to watch
- The global growth pulse: Industrial demand expectations and China-linked signals.
- The Australian dollar: The post-decision move can become a second driver for the sector.
- Sector leadership: How resources trade versus the broader market can signal the current regime.
Potential trigger
If the RBA tone turns more restrictive while global growth stays stable, resources may hold up better than other parts of the market. Strong cash flows can matter more, and the real asset angle can attract buyers.
Key risks
- In a real stress event, correlations can jump, and defensive positioning can fail.
- If policy tightens into a growth scare, the cycle can take over, and the sector can fade quickly.
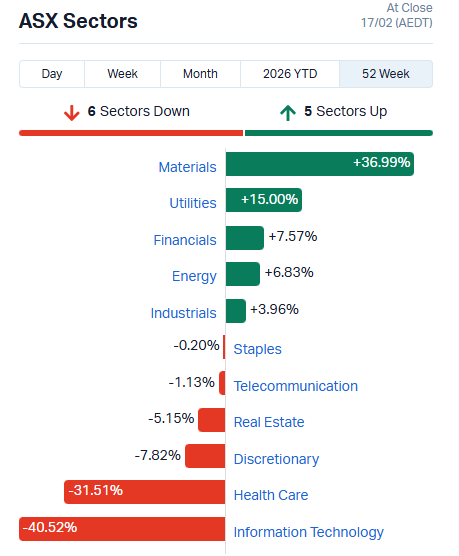
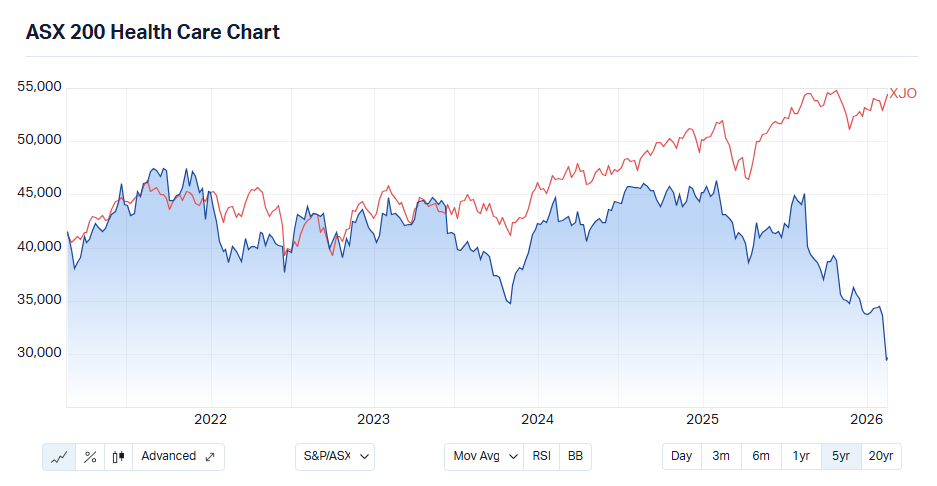
4. Defensives, staples, and quality healthcare
Defensives are meant to be the calmer corner of the market when everything else feels messy. In 2026, they still have one big weakness: discount rates.
Quality defensives can draw inflows when growth looks shaky, but some defensive growth stocks still trade like long-duration assets. They can be hit when yields rise, even if the business looks solid. That means earnings may be steady while valuations still move around.
What to watch
- Relative strength: How defensives perform during RBA weeks versus the broader market.
- Guidance language: Comments on cost pressure, pricing power, and whether volumes are holding up.
- Yield behaviour: Rising yields can overpower the quality bid and push multiples down.
Potential trigger
If the RBA sounds hawkish and cyclicals start to wobble, defensives can attract relative inflows, but that can depend on yields staying contained. If yields rise sharply, long-duration defensives can still de-rate.
Key risks
- Cost inflation that squeezes margins and weakens the defensive story.
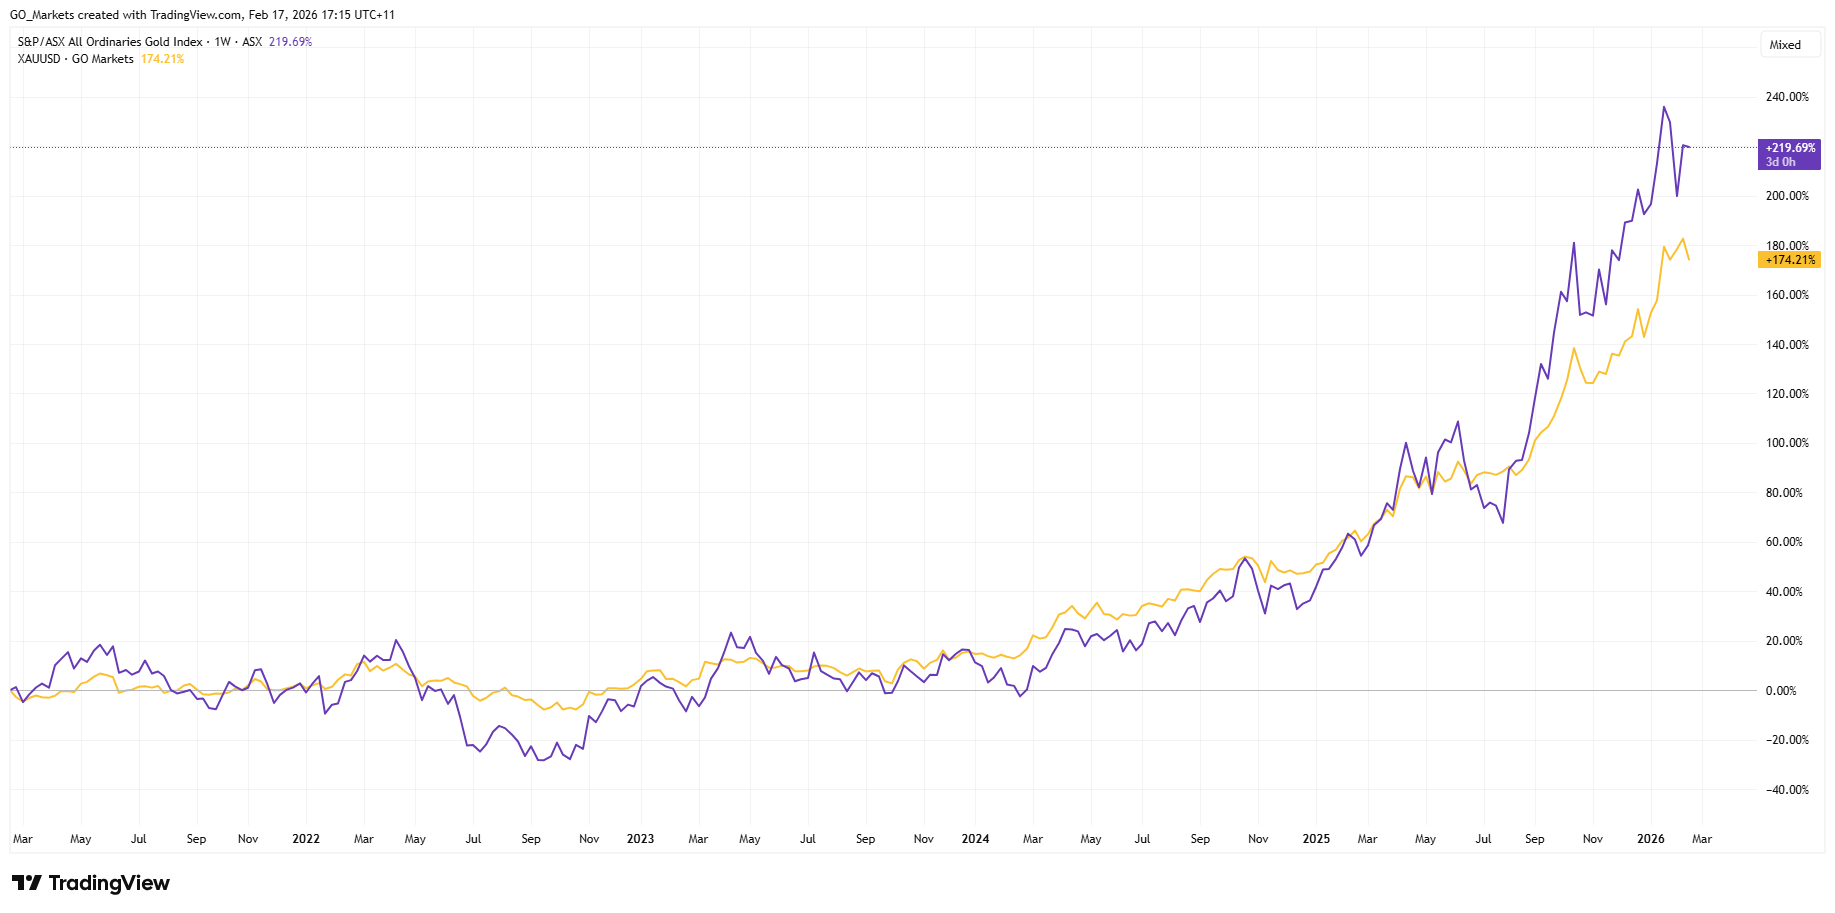
5. Hard assets, gold, and gold equities
In 2026, hard assets may be less about the simple inflation-hedge story and more about tail risk and policy uncertainty.
When confidence weakens, hard assets often receive more attention. They are not driven by one factor, and gold can still fall if the main drivers run against it.
What to watch
- Real yield direction: Shapes the opportunity cost of holding gold.
- US dollar direction: A major pricing channel for gold.
- Gold equities versus spot gold: Miners add operating leverage, and they also add cost risk.
Potential trigger
If the market starts to question inflation control or policy credibility, the hard-asset narrative can strengthen. If the RBA stays restrictive while disinflation continues, gold can lose urgency, and money can rotate into other trades.
Key risks
- Real yields rising significantly, which can pressure gold.
- Crowding and positioning unwinds that can cause sharp pullbacks.
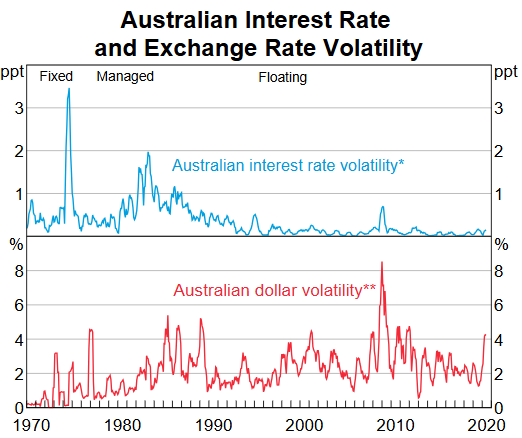
6. Market plumbing, FX, rates volatility, and dispersion
In some RBA weeks, the first move shows up in rates and the Australian dollar, and equities follow later through sector rotation rather than a clean index move.
When guidance shifts, the RBA can change how markets move together. You can end up with a flat index while sectors swing hard in opposite directions.
What to watch
- Front-end rates: Repricing speed right after the decision can reveal the real surprise.
- AUD reaction: Direction and follow-through often shape the next move in equities and resources.
- Implied versus realised volatility: Can show whether the market paid too much or too little for the event.
- Options skew: Can reflect demand for downside protection versus upside chasing.
- Early tape behaviour: The first 5 to 15 minutes can be messy and can mean-revert.
Potential trigger
If the decision is expected but the statement leans hawkish, the front end may reprice first, and the AUD can move with it. Realised volatility can still jump even if the index barely moves, as the market rewrites the path and rotates positions under the surface.
Key risks
- A true surprise that overwhelms what options implied and creates gap moves.
- Competing macro headlines that dominate the tape and drown out the RBA signal.
- Thin liquidity that creates false signals, whipsaw, and worse execution than models assume.
7. Theme baskets
Theme baskets may let traders express a macro regime while reducing single-name risk. They also introduce their own risks, especially around events.
What to watch
- What the basket holds: Methodology, rebalance rules, hidden concentration.
- Liquidity and spreads: Especially around event windows.
- Tracking versus the narrative: Whether the “theme” behaves like the macro driver.
Potential trigger
If RBA language reinforces a “restrictive and uncertain” regime, theme baskets tied to value, quality, or hard assets may attract attention, particularly if broad indices get choppy.
Key risks
- Theme reversal when macro expectations shift.
- Liquidity risk around event windows, where spreads can widen materially.
The point of this playbook is not to predict the exact headline; it is to know where the second-order effects usually land, and to have a short checklist ready before the decision hits.
Keeping these triggers and risks in view may help some traders structure their monitoring around RBA decisions throughout 2026.
FAQs
Why does “tone” matter so much in 2026?
Because markets often pre-price the decision. The incremental information is guidance on whether the RBA sounds comfortable, concerned, or open to moving again.
What are the fastest tells right after a decision?
Some traders look to front-end rates, the AUD, and sector leadership as early indicators, but these signals can be noisy and influenced by positioning and liquidity.
Why are REITs called duration trades?
Because a large part of their valuation can be sensitive to discount rates and funding costs. When yields move, valuations can reprice quickly.
Are defensives always safer around the RBA?
Not always. If yields jump, long-duration defensives can still be repriced lower even with stable earnings.
Why do hard assets keep showing up in 2026 narratives?
Because they can act as a hedge when trust in policy credibility wobbles, but they also carry crowding and real-yield risks.

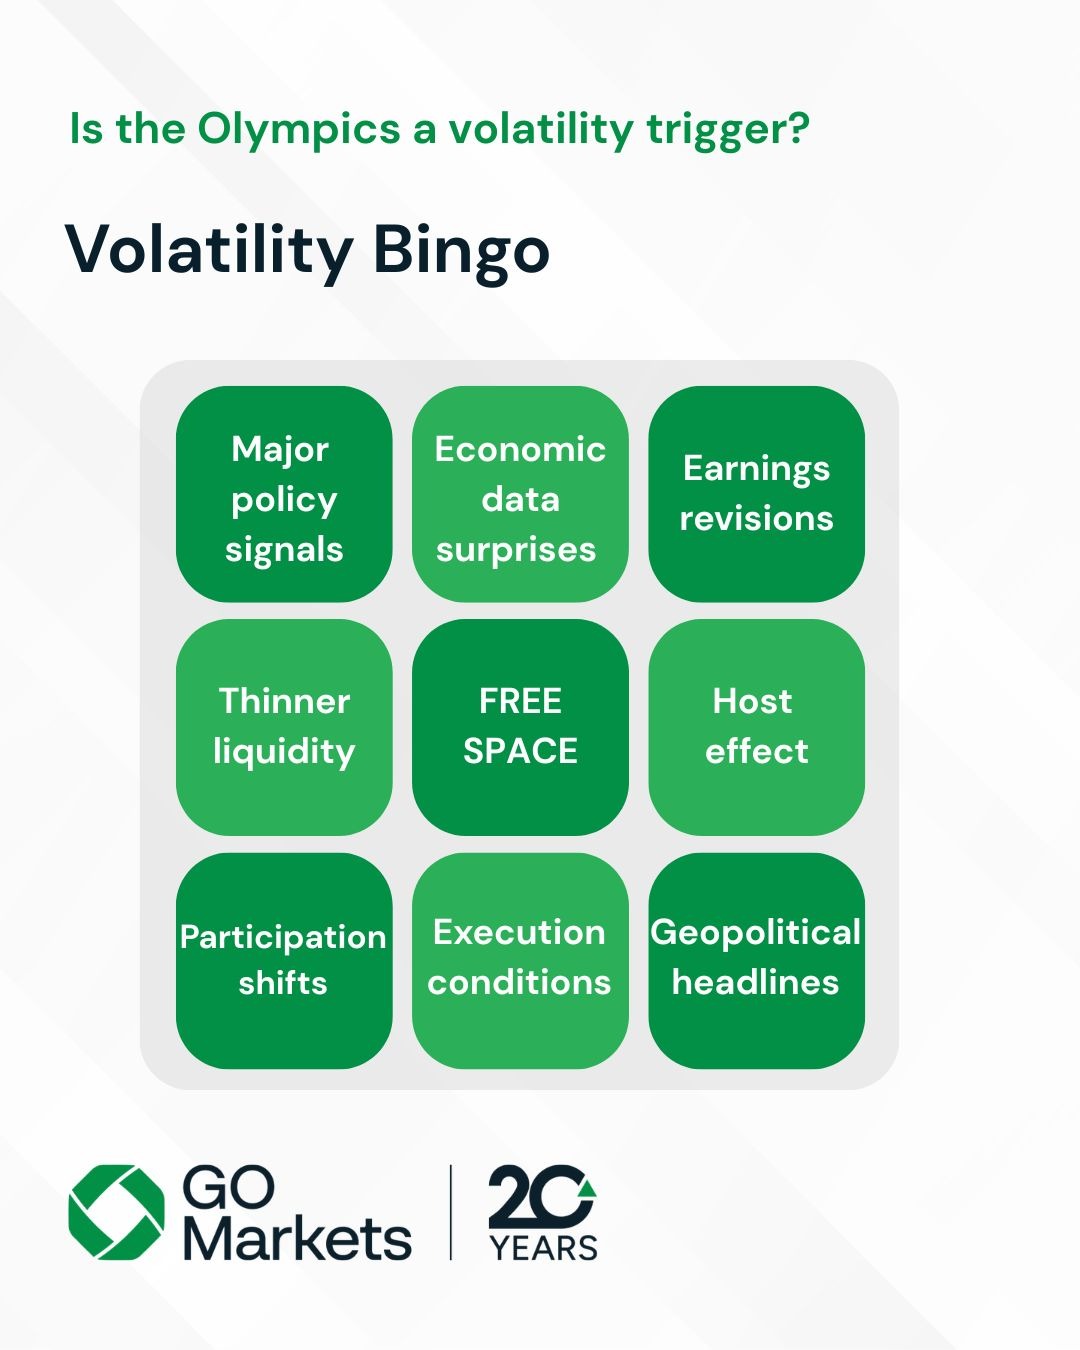
Big global events like the Olympics can pull attention away from markets, shift participation, and thin out volume in pockets.
When that happens, liquidity can appear lighter, spreads can be less consistent, and short-term price action can become noisier, even if broader index-level volatility does not change materially.
So instead of asking “Do the Olympics create volatility?”, a more practical lens is to ask “What volatility events could show up during the Games?”
Quick facts
- Evidence is generally weak that the Olympics themselves are a consistent, direct driver of market volatility.
- Volatility spikes that occur during Olympic windows have often coincided with bigger forces already in motion, including macro stress, policy surprises, and geopolitics.
- The more repeatable Olympics-linked impact tends to be around execution conditions, not a new fundamental market regime.
Olympic “volatility bingo”, how it works
Think of it as a checklist of common volatility triggers that can land while the world is watching.
Some “volatility bingo” squares are timeless, like central banks and geopolitics. Others are more modern, such as cyber disruption risk, climate activism, and social flashpoints surrounding host-city logistics.
Macro and policy
Central bank shock
When policy expectations shift, markets can move regardless of the calendar.
London 2012 is a reminder that the story was not sport. It was the Eurozone. In late July 2012, ECB President Mario Draghi delivered his “whatever it takes” remarks in London, at a time when sovereign stress was a dominant volatility theme.
Macro stress already underway
Beijing 2008 took place in a year defined by the global financial crisis, with volatility tied to credit stress and repricing risk appetite, not to the event itself. The Games ran from 8 August 2008 to 24 August 2008.
Geopolitics and security
Regional conflict timing
During Beijing 2008, the Russia-Georgia conflict escalated in early August 2008, overlapping with the Olympic period. The market lesson is that geopolitical repricing does not pause for major broadcasts.
“After the closing ceremony” risk
Beijing 2022 ended on 20 February 2022. Russia’s full-scale invasion of Ukraine began on 24 February 2022, only days later.
This is a classic “bingo square” because it reinforces the same principle. A geopolitical escalation can land near a global event window without necessarily being caused by it.
Security incident headline shock
The Olympics have also been directly impacted by security events, even if those events are not “market drivers” on their own.
Two historic examples that shaped the broader security backdrop around major events are:
- The Munich massacre during the 1972 Summer Games.
- The 1996 Atlanta Olympics bombing in Centennial Olympic Park.

Modern host-city climate
Environmental and anti-Olympics protests
Host city activism is not new, but the themes have become more climate and infrastructure-focused.
Paris 2024 saw organised protests and “counter-opening” events. Reporting around Paris also referenced environmental protest attempts by climate groups.
The current 2026 Winter Olympics opened amid anti-Olympics protests in Milan, with reporting that included alleged railway sabotage and demonstrations focused in part on the environmental impacts of Olympic infrastructure.
These types of headlines can matter for markets indirectly, through risk sentiment, transport disruption, policy response, and broader “instability” framing.
Cyber disruption risk
The cyber “bingo square” has become more prominent in modern Games.
France’s national cybersecurity agency ANSSI reported 548 cybersecurity events affecting Olympics-related entities that were reported to ANSSI between 8 May 2024 and 8 September 2024.
Even when events are contained, cyber incidents can still add noise to headlines and confidence.
Logistics and “can the event run” controversy
Sometimes the volatility link is not the Games, but the controversy around delivery.
Paris 2024 had high-profile scrutiny around the Seine and event readiness, alongside significant public spending to clean the river and ongoing debate about water quality risks.
Health and disruption narratives
Public health concerns
Rio 2016 is a reminder that health risk narratives can become part of the Olympic backdrop, even when the market impact is indirect.
Zika concerns were widely discussed ahead of the Games, including debate about global transmission risk and travel-related spread.
The “postponement era” memory
Tokyo 2020 was postponed to 2021 due to COVID-19, which underlined that global shock events can dominate everything else, including major sporting calendars.

Practical takeaways for traders
The most repeatable Olympics-era shift is often not “more volatility”, but different execution conditions.
During major global events, some traders choose to watch spreads and depth for signs of thinning liquidity, trade less when conditions look choppy, and stay aware that geopolitical, cyber, and protest headlines can hit at any time.
In global markets of enormous scale, sport is usually not the catalyst. The bingo squares are.

The Olympic and Winter Olympic Games capture global attention for weeks, drawing millions of viewers and dominating headlines. For traders, this attention often feels like a catalyst, yet the real market drivers remain the same: macroeconomics, policy, and global risk sentiment, not the sporting calendar.
So why do some traders say results feel weaker during major sporting events?
Often it comes down to a failure to adapt to conditions that can shift at the margin, particularly liquidity and participation.
1. Expecting “event volatility”
A major global event can create an assumption that markets should move more. Some traders position for breakouts or increase risk in anticipation of bigger swings, even when conditions don’t support it.
Key drivers
- In some markets and sessions, reduced participation can weaken trend follow-through
- Sentiment can inflate expectations beyond what price action delivers
Example: A trader expects a breakout during the Olympic opening ceremony period, but low regional participation limits price movement, leading to false starts.
2. Forcing trades in quiet sessions
When price action is slower and ranges compress, some traders feel pressure to stay active and take lower-quality entries.
Key drivers
- Narrow intraday ranges can increase false signals
- Lower conviction can favour consolidation over trend, raising false-break risk
- “Staying engaged” can reduce selectivity
Takeaway: Use quieter sessions to refine setups or review data rather than forcing marginal trades.
3. Ignoring thinner liquidity
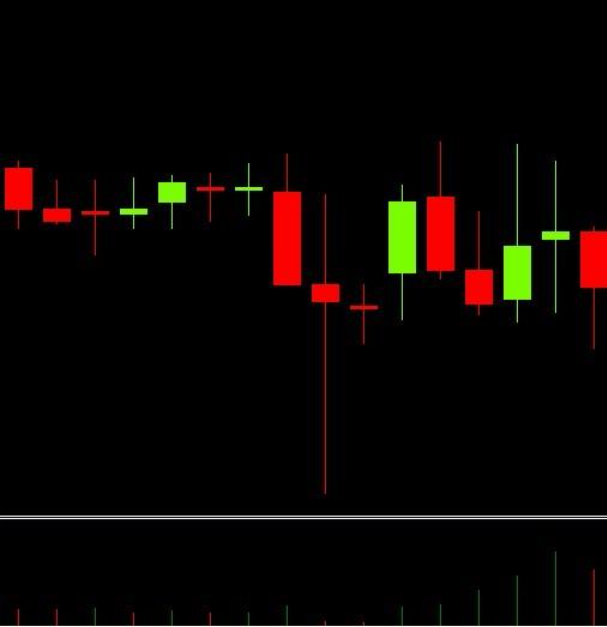
Participation can ease slightly during major global events, and the impact is often more pronounced on shorter timeframes. Daily charts may look normal, while intraday price action becomes choppier with more wicks.
Key drivers
- In lower-depth conditions, price can jump more easily, and wick size can increase
- In some instruments and sessions, thinner liquidity can coincide with wider spreads and more variable execution (varies by market, venue and broker conditions)
Timeframe sensitivity to thinner conditions

The above table is illustrative only (varies by market): Daily charts may look normal. Five-minute charts can feel more erratic.
Low volume big wicks example
4. Using normal size in abnormal conditions
Even if overall volatility looks stable, execution risk can rise when liquidity thins, especially for short-term or scalping-style approaches.
Key drivers
- Slippage can increase, and stops may “overshoot”
- Thin conditions can trigger stops more easily in noise
- Wider spreads can shift entry/exit outcomes versus normal conditions
Adjustment: Maintaining fixed sizing may distort effective risk. Some traders review transaction costs, including spreads, and execution conditions when setting risk parameters such as stops/limits, particularly in thinner sessions.
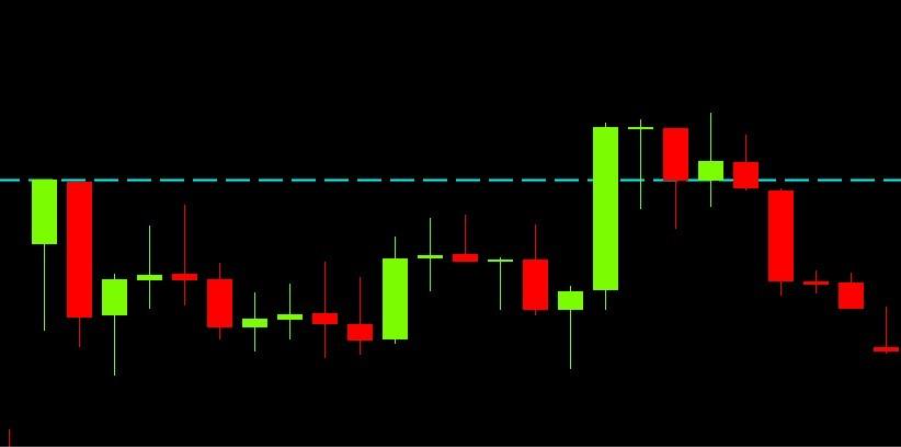
5. Trading breakouts with low follow-through
Trend-following tactics can falter when participation declines. Momentum may dissipate quickly, and false breaks become more common.
Key drivers
- Reduced flow can limit sustained directional moves
- Some low-liquidity regimes may favour mean reversion over momentum
Example: A classic range breakout appears valid intraday but fades rapidly as follow-through volume fails to materialise.
Failed breakout example
6. Overlooking timing and distraction risk
There is no reliable evidence that the Olympic calendar predictably drives geopolitical events. But when tensions are already elevated, major global events can sometimes coincide with attention being spread elsewhere, somewhat similar to holidays, elections or major summits.
Traders should identify when conditions are slower or thinner and adjust accordingly, aligning tactics with reduced follow-through risk and calibrating position sizes to execution reality. Most importantly, avoid forcing trades when edge is limited during these periods.
Upcming economic events


The decision to scale (increase the traded lot size of a specific EA) should be based on statistical evidence that indicates your EA has the potential to perform to certain expectations.
Equal weight should be given to the decision to scale, as to the initial decision to deploy an EA. This guide provides an indicative approach on how to put together and action your scaling plan.
Before You Start Your Scaling Plan
Important: this should be an individual plan that is consistent with your personal trading objectives, your EA portfolio, and your personal financial situation (including account size).
We are going to use a starting lot of 0.10 per trade in the examples in this document —you want to adjust this based on your own risk tolerance.
Whatever your chosen lot size start point, EA scaling should be a pre-planned incremental approach, scaling stepwise based on performance metrics you are seeing in your live trading account.
You should also have assessed the current margin usage of your EA portfolio exposure to ensure that any scaling and related increased margin requirements are appropriate to the size of your account.
Suggested Scaling Baseline Requirements
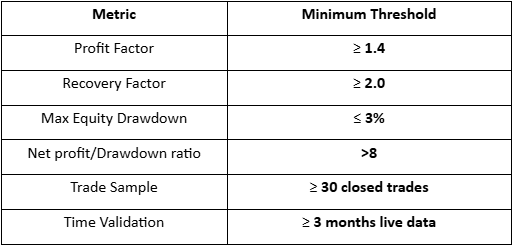
Scaling should only be performed when your EA is performing to what you deem to be a good standard. To make this judgment, you need to set some minimum performance standards.
The past performance of your EA is not a guarantee of future performance. If market conditions change, you must remain vigilant and continue to measure performance on an ongoing basis for every live EA you have.
You need to define the key metrics that are important to you.
Two important metrics to include are:
- The number of trades: to provide some evidence of reliability
- The period of time: to have had exposure to at least some variation in market conditions
Example of how you may lay your metrics out in a table:
Some may choose to include proximity to original expectations of other metrics, such as minimum win rate, average profit in winning trades, and average loss in those that go against you.
It should only be after your metrics are met that lot scaling begins on any specific EA.
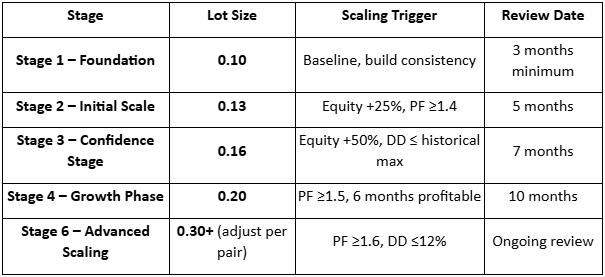
Lot Size Scaling Ladder
Below is an example of a performance-based scaling plan assuming a 0.10-lot baseline.
Again, this is indicative. It provides a framework with clear review dates and an approach that illustrates incremental scaling. You must still define a regime that is right for your specific trading objectives.
Risk Guardrails
It is vital to keep an eye on your general account risks and have limits in place that guide your EA use.
Such limits must be constant across all stages of scaling and referenced beyond the risk of a single EA, but to your portfolio as a whole.:
Per-Trade Risk (Nominal)
Trade risk for any one trade should be seen in the context of account size and the dollar risk based on the risk parameters you have set for your EA.
Specify a maximum percentage of the account balance — a $200 loss is more impactful on a $1000 account compared to a $10,000 account.
Stick to what is right for you in terms of your tolerable risk level based on your trading objectives and financial situation. A common suggestion is a 1-2% risk of account equity per trade.
Total Open Exposure
Specifying maximum exposure in the number of EAs open at any time and those that use the same asset class is important for overall portfolio risk management.
There are tools you can use to monitor exposure risk generally, as well as those that can be used to indicate single asset exposure.
Margin Usage
It is always desirable that your set exit approaches and parameter levels are what your exits are based on. It should not be because your margin usage has meant you have moved into a margin call situation.
Specify a minimum level to adhere to and make sure that your account is sufficiently funded. If volatility or slippage rises (e.g., news events or illiquid sessions), reduce lot size temporarily.
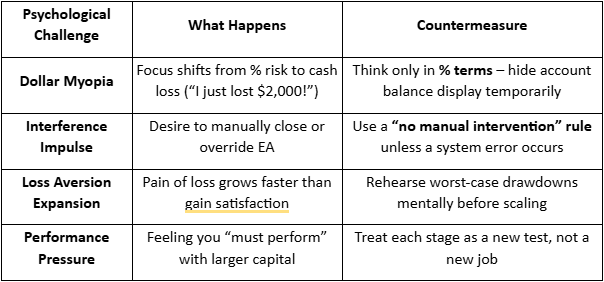
Scaling Psychology – Managing “Big Numbers”
As lot sizes rise, your emotions may respond accordingly when you see the larger dollar amounts that your EA is generating.
If you are used to seeing an average profit of $100 and average loss of $50, and suddenly you are seeing significantly bigger numbers, it creates an emotional challenge where you may be tempted to do a “discretionary override”.
Although there are situations, such as major market events, overexposure in a specific asset, or VPS or account system problems, where such intervention may be considered, generally this would distort the actual performance evaluation of your EA and is not encouraged (unless it is pre-planned).
The table below presents some of the generally accepted challenges and offers suggestions on how to manage them.
Your Plan Into Action…
In practical terms, your scaling plan should have two components:
- The key parameters for action on your chosen key metrics
- Specified periodic review times to make your next scaling decision
This is not a race. Having systems in place facilitates creating the opportunity that scaling brings while still mitigating the risks.

There are few trades as appealing, or as risky, as trying to catch a market reversal. The idea of entering at the turning point and riding the new trend is exciting. However, most traders fail to consistently produce good trading outcomes on this potential, often entering too early without confirmation, and thus get caught at a pause point of a continuing powerful move.Trend reversals can indeed offer excellent reward-to-risk potential, but as with any trading approach, only when approached systematically, the confluence of key factors, and timing.
What Is a High-Probability Entry?
Before diving into reversals specifically, let’s define what we mean by a high-probability entry.A high-probability entry is a trade taken in conditions where:
- There is clear evidence from price action and structure
- There is an alignment with the overall market context, such as timing, favourable price levels, and volatility
- Risk can be logically defined and limited to within your tolerable limits
- It may offer a favourable risk-to-reward profile (providing you execute following a pre-defined plan)
This approach should underpin all trading strategy development. And be consistently executed according to your defined rules, which must be constantly reviewed and refined based on trading evidence.
Reversal vs. Retracement: Know the Difference
Many traders confuse a retracement with a reversal, often with potentially costly consequences. It is ok to exit on a retracement and be ready to go again if there is a breach of the previous swing high. But this must be part of your plan, with a strategy for trend continuation in place. However, if your plan suggests that you DON’T want to exit on retracements, then the following table gives some guidance on what potential differences may be. RetracementReversalA temporary move against the trendA complete shift in directional controlPrice often continues in original directionPrice begins trending in the opposite directionHealthy part of a trend’s rhythmMarks the end of a trendTypically shallow, to a Fib/MA/structureOften deep, may break previous swing structureVolume often reduced after swing high if long or swing low if short.Volume often increased after swing high if long or visa versa.
Understanding Trend Exhaustion
Before any reversal occurs, the existing trend must show signs of exhaustion. This is the first phase of a potential turning point — and one of the most overlooked.
How Trend Exhaustion Looks on a Chart:
- Climactic candles – multiple wide-range bars with expanding bodies.
- Failed breakouts – price pushes through a level but fails to hold.
- Reduced momentum – smaller candles, overlapping wicks, indecision bars.
- Volume spikes with no follow-through – smart money distributing or exiting.
- Multiple tests of the same level – a sign that the trend is running out of energy.
The Anatomy of a High-Probability Reversal
A strong reversal setup typically has three key factors that can be supportive of a of follow-through.
1. Location – Price at a Key Zone
- Major support/resistance level honoured
- Prior swing highs or lows at a similar price point
- Higher timeframe structure – I,e, agreement on a 4 hourly chart as well as an hourly.
In simple terms, if the price isn’t at a meaningful location, a meaningful reversal is less likely to occur.
2. Previous Signs of Trend Exhaustion
We have covered this above, with evidence that the current trend has now weakened, and there is some justification to prepare to enter a counter-trend.
3. Structural Confirmation
This is the trading trigger you are looking for as a potential signal for entry. Structural confirmation transforms an idea (“the price might reverse”) into an actual setup (“the reversal is underway”).Look for the following four signs:
- Trendline or key short-term moving average breached
- Lower highs and lower lows in an uptrend or higher lows in a downtrend
- Confirmation that a key swing point has been honoured
- Evidence that a retest and rejection of the broken structure has occurred.
This shows that momentum has not just stalled, it has now shifted.
Context Filters
Reversals are more likely to succeed when conditions are supported by other factors. This is to do with the identification of a strong market context where reversals are more likely to happen. These may include:
- Time of day: The open of London or US sessions, or into session close when there may be some profit taking on a previously strong move
- Volatility extremes: Price has expanded beyond its normal daily range (ATR-based or visually evidenced on a chart)
- Market sentiment: Everyone is already long at the top or short at the bottom — setting up for a squeeze
- Catalysts: Reactions to news, or data, that may cause a significant one-sided move
Adding context could make the difference between a technically correct trade and one that may offer a higher probability of going in your desired direction.
Recognising Common Reversal Patterns
There are classic chart patterns that may help visually reinforce the principles. They reflect exhaustion, rejection, and structural change, and may encourage many traders to follow the move, adding extra momentum to any initial move. PatternSignal TypeKey ClueConfirmation NeededDouble Top/BottomReversal StructureRepeated rejection of key levelBreak of swing low/high between peaksHead & ShouldersMomentum FailureFailed retest after strong pushNeckline breakPin BarExhaustion CandleSharp rejection with long wickOpposite-direction close after the pinEngulfingSudden Power ShiftOne candle overtakes previous rangeFollow-through candleRounding Top/BottomSlow Institutional TurnGradual stalling and reversalNeckline break of curveBreak of Structure (BoS)Structural ConfirmationNew higher low/lower high, support breakRetest and failure to reclaim broken level⚠️ These patterns should not be traded in isolation. Use them with context and only after signs of exhaustion and structure shifts.
FOUR Trader Reversal Traps to Avoid
Even with a solid framework, it’s easy to fall into common traps:
- Trying to pick the exact top or bottom - Wait for price to prove the turn, don’t anticipate and enter early
- Entering against the higher timeframe trend – Zooming out and checking alignment with higher timeframes may be prudent to reduce the likelihood of having to fight momentum on larger timeframes.
- Trading every reversal signal - Not all signals are valid or particularly strong. Look for the confluence of multiple factors covered earlier, not just the presence of a pattern.
- Letting bias override evidence - Just because you want a reversal to happen, it NEVER means it is there unless backed up by evidence.
Don’t Forget the Full Trading Story
A great setup means nothing without excellent execution. These ESSENTIAL facts are critical as with any trade, but there will never be an apology for reinforcing these.
Patience and execution discipline
Wait for your full criteria to be met. Avoid “almost” setups that feel tempting but don’t fully align with your full plan criteria. Likewise, when all your boxes are ticked, then take action.
Exit strategy
Use a mix of targets, structure-based trails, or scaling out, and know in advance how you’ll manage the trade once it starts moving.High-probability entries are only one part of a winning trade. Exit efficiently or you’ll waste great entry setups because of poor execution. There are many traders in this position; make sure you are not one of them.
Summary
High-probability reversals are not about being right at the top or bottom when you enter; this is rarely possible and adds additional risk without confirmation. They are about recognising and being ready when the trend is potentially changing, and taking action when:
- Price is at a key level
- The current trend shows clear signs of exhaustion
- Structure confirms the shift
- And context supports the move
Trade the evidence and your plan, not just what you think is likely to happen. Be patient, be ready, and when the setup is there, execute your trade with confidence.

Crude Oil has always been one of the most popular and highly traded markets for CFD traders whether it is WTI or Brent, especially recently as geopolitical and economic forces have seen its price fluctuate from extreme lows to extreme highs. It’s easy to see why, Oil is a bellwether for the health of the global market, oil greases the wheels of global commerce and with CFDs it’s possible to take a position in this exciting market, whether you think the price will head up or down. In this CFD Oil trading Article we will look at the following: How to use CFDs to trade oil Fundamental forces that drive the price of oil Popular technical strategies for trading oil CFDs How to use CFDs to trade oil CFDs or Contracts For Difference allow you to speculate on the price of oil, without owning the underlying asset.
A spot oil CFD tracks the price of the spot market being the cleanest and most efficient way to speculate on the price of oil. They also allow you to take a position in both directions, you would enter a buy (Long) positions if you believed the price will rise, or a sell (Short) position if you believe the price will fall. With Long positions you are looking to buy and sell at a higher price at a later time to profit on the trade.
With a Short position you are selling with the view to buy back at a later time to profit on the trade. At GO Markets we offer our clients the worlds most popular oil trading platform in Metatrader 4 and 5, another advantage to these CFD trading platforms is the ability to automate oil trading strategies. Other advantages to trading oil CFDs with GO Markets: Trade 23 hours a day on WTI oil, 21 hours a day on Brent oil, unlike an ETF or oil company listed on a stock exchange that is only open while that stock exchange is open.
Leverage – the margin required to open the trade will be a fraction of the face value of the position depending on what leverage you are comfortable with. Flexibility in position sizing starting from 0.1 lot ($0.10 USD per point movement in oil) unlike oil futures which have rigid contract sizes. Rolling contract, no expiries such as in options or futures to worry about.
To Enter a position in Metatrader, you would bring up a deal ticket by clicking “New Order” then select your position size, any Stop Loss or Take Profit levels you want the position to automatically close at and hit Buy or Sell. As with any instrument, make sure you are familiar with the lot sizing. 1 standard lot in oil (USOUSD and UKOUSD) is 100 barrels, or $1 USD a point so make sure you set the volume to a level commensurate to your account size and risk appetite. Now, the next question is how you decide on a buy or sell, let’s look at the fundamentals of what drives oil and some technical analysis you can use to answer this question.
Fundamental forces that drive the price of oil Both WTI oil (USOUSD) and Brent Oil (UKOUSD) are highly correlated and will both be referenced as “oil” in the below. While no one reason can be fully attributed to movements in the price of oil, there are an important few fundamental drivers that will influence the price and whose relationship has been time tested. None of these on their own should be used as a sole reason to enter a position, but having the fundamentals on your side will certainly give you an advantage.
The main fundamental drivers in my experience are The perceived health of the global economy OPEC+ production cuts or increases Geopolitical issues The perceived health of the global economy Oil is the driver of commerce, it is needed for the transport and manufacturing of goods and getting people around. If economic conditions are deteriorating, it means less economic activity and the need for less oil sending the price down. A global economy which is seen as “hot” means more economic activity and more demand for oil, seeing it’s price increase.
A clear chart to see this is the price of oil as compared to the US 10-year bond yield over the years. You can see the price of oil and the yield are highly correlated, this is due to yields going up when the economy is “hot” and yields falling when the economy enters a period of contraction, similar price drivers to oil. The black line is WTI oil price, the orange US 10-year yields going back 10 years.
Source: tradingview.com OPEC+ production cuts or increases The Organization of the Petroleum Exporting Countries (OPEC) is a cartel of leading oil-producing countries formed in order to collectively influence the global oil market. OPEC started with a handful of Middle Eastern oil producers in 1960, and has since grown to 24 members in OPEC+. Even thought the USA is currently the worlds top oil producer, OPEC+ countries as a whole still dominate global oil supply and decisions made by the cartel can have a dramatic influence on the price of crude oil.
Market share of oil producing nations: Source: gisreportsonline.com OPEC+ hold regular meetings during the year, normally the expected result is well telegraphed, but sometimes there can be a surprise, such as at their latest meeting on Sunday April 2 nd, 2023, where a surprise production cut was announced, seeing the price of oil gap significantly higher on Mondays open, showing oil traders to always approach these meetings with caution. Geopolitical issues The last three years has seen some very influential geopolitical events, or “black swans” and oil being closely tied to the health of the global economy has seen some very big moves on the back of these events. The Pandemic and its related lock downs and slowing of global commerce saw the price of oil slump to all time lows, followed by the war in Ukraine which saw oil jump to multi year highs on the fear of supply disruptions (Russia is the second biggest oil producer in the world) The chart below illustrates this: Oil traders especially need to be aware of geopolitical risks as the above chart shows.
Technical strategies for trading oil CFDs While having a good understanding of the fundamentals (in my opinion) is important to help you choose the best trades most traders will use a combination of technical analysis and fundamentals with the aim for higher probability outcomes in their trades. Some traders will use technical analysis exclusively without any interest in the fundamental drivers using things such as RSI oscillators, support and resistance areas and trend lines solely to decide on their trade direction. Which option is best is solely up to the trader, their time frames for the trades and risk appetite, all can work, and all can fail neither option can be seen as “better” than the other, it all depends on the individual trader.
Technical analysis is an art in itself and there is a lot to learn on this subject, I encourage anyone interested to research the many weird and wonderful technical analysis strategies that are documented online. But let’s take a look at a popular technical indicators that oil traders use to make their trades. Support and Resistance Support and resistance are one of the most widely used and accurate (when used correctly) technical indicators that can be used by traders.
Support and Resistance areas are points in the market where the price is held from going lower (Support) or going higher (Resistance), these are areas where buyers or sellers are entering the market as they see value in the asset at that price. These levels can last a long time or be temporary and can be used to predict turn arounds in the market, or a break of these levels could indicate a further push in that direction. Oil is also particularly sensitive to psychological levels around “big figures” or rounded number, e.g. 79.00 and 74.00 As can be seen on the chart below.
Hopefully this article has given you an interest to learn more about trading oil with CFDs. Feel free to contact the GO Markets team if you have any questions on trading oil CFDs and opening an account with us.